Usage
Example data
IOAPIPytools includes two data files to illustrate the examples below:
1. A small EDSS/Models-3 I/O API data file (SiB_20080701_1.25x1.0_IOAPI.nc) containing four hours of CO2 gross primary productivity (GPP) and carbonyl sulfide (COS or OCS) GPP from the Simple Biosphere Model v. 3.0 (Sellers et al., 1996; Baker et al., 2008, 2010).
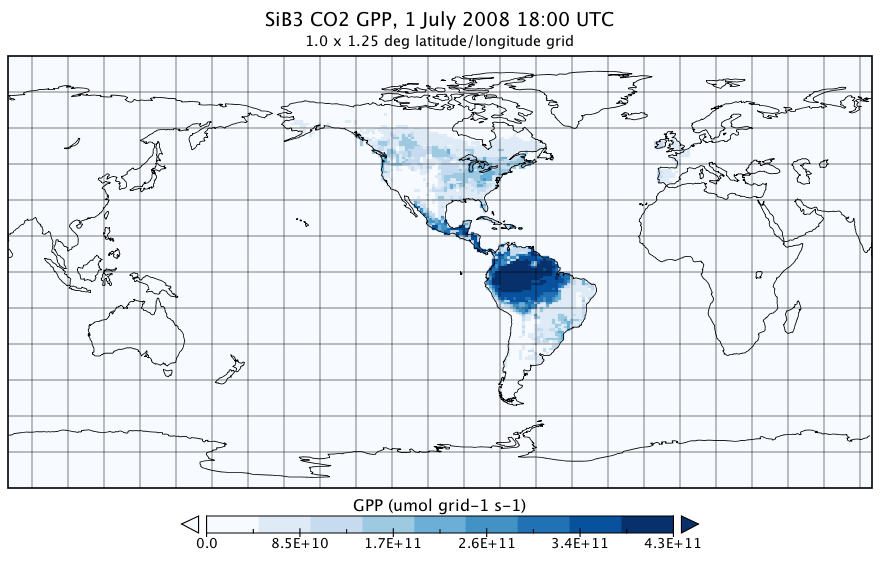
Figure 1: First time step of SiB_20080701_1.25x1.0_IOAPI.nc. Click image for full-size version.
2. An EDSS/Models-3 I/O API “GRIDDESC” file (GRIDDESCSiB) that describes two coordinate systems: the 1.0 x 1.25 degree global grid of the native SiB data (SiB_grid), and a North Pole stereographic grid with 60 kilometer grid cells that spans most of North America (ARCNAGRID).
Example 1: Calculating regridding matrices
This example calculates matrices to regrid SiB data from its native global 1.25 degree by 1.0 degree lat/lon grid to a North Pole stereographic grid centered over North America.
1 2 3 4 5 6 7 8 9 10 11 12 | from IOAPIPytools import ioapi_pytools
import pkg_resources # to access the example data files
import os
DATA_PATH = pkg_resources.resource_filename('IOAPIPytools', 'data/')
fname_griddesc = os.path.join(DATA_PATH, 'GRIDDESCSiB')
ioapi_pytools.calculate_regrid_matrix(fname_griddesc=fname_griddesc,
fname_matrix='my_regrid_matrix',
fname_mattxt='my_regrid_mattxt',
in_grid='SiB_grid',
out_grid='ARCNAGRID',
col_refinement=2,
row_refinement=2)
|
Example 2: Regridding data
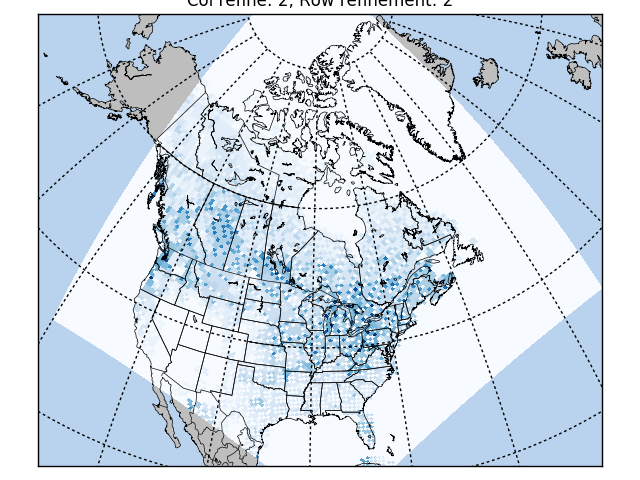
This example picks up where example 1 ended, using the matrices calculated in example 1 to regrid the SiB CO2 GPP to the 60-kilometer North American grid described in GRIDDESCSiB.
1 2 3 4 5 | fname_data = os.path.join(DATA_PATH, 'SiB_20080701_1.25x1.0_IOAPI.nc')
ioapi_pytools.run_regrid(fname_raw=fname_data,
fname_regridded='SiB_20080701_60km_IOAPI.nc',
fname_matrix='my_regrid_matrix',
fname_mattxt='my_regrid_mattxt')
|
Figure 2: Results of example 2 as written (first time step of the regridded data). Column refinement = 2, row refinement = 2. |
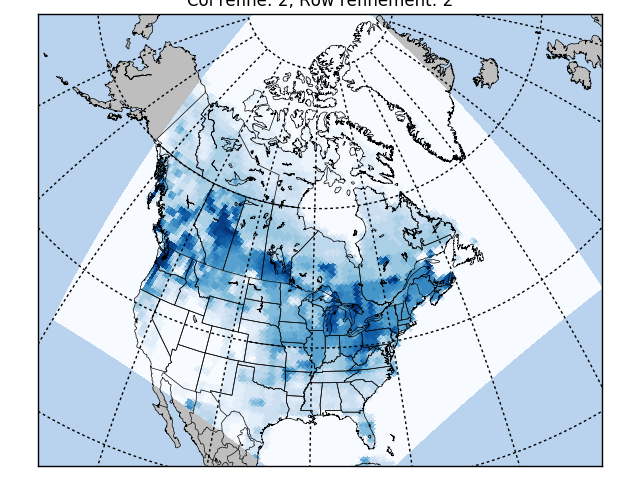
Figure 3: Same as fig 2., but higher resolution column and row refinement. Column refinement = 1000, row refinement = 1000. |
References
Baker, I. T., L. Prihodko, A. S. Denning, M. Goulden, S. Miller, and H. R. da Rocha (2008), Seasonal drought stress in the amazon: Reconciling models and observations, Journal of Geophysical Research: Biogeosciences, 113(G1), n/a–n/a, doi:10.1029/2007JG000644.
Baker, I. T., A. S. Denning, and R. Stöckli (2010), North American gross primary productivity: Regional characterization and interannual variability, Tellus B, 62(5), 533–549, doi:10.1111/j.1600-0889.2010.00492.x.
Sellers, P. J., D. A. Randall, G. J. Collatz, J. A. Berry, C. B. Field, D. A. Dazlich, C. Zhang, G. D. Collelo, and L. Bounoua (1996), A Revised Land Surface Parameterization (SiB2) for Atmospheric GCMS. Part I: Model Formulation., Journal of Climate, 9, 676–705.
This is a work in progress - stay tuned!
| Updated: | 18 January 2017 |
|---|